


The support and resistance

To find the target first need to find the support and resistance.
Resistance is always greater than the current market price.
S&R construction
For intraday and BTST at least 3-6 months data points/
For long-term 12-18 months data points (used for swing trade).
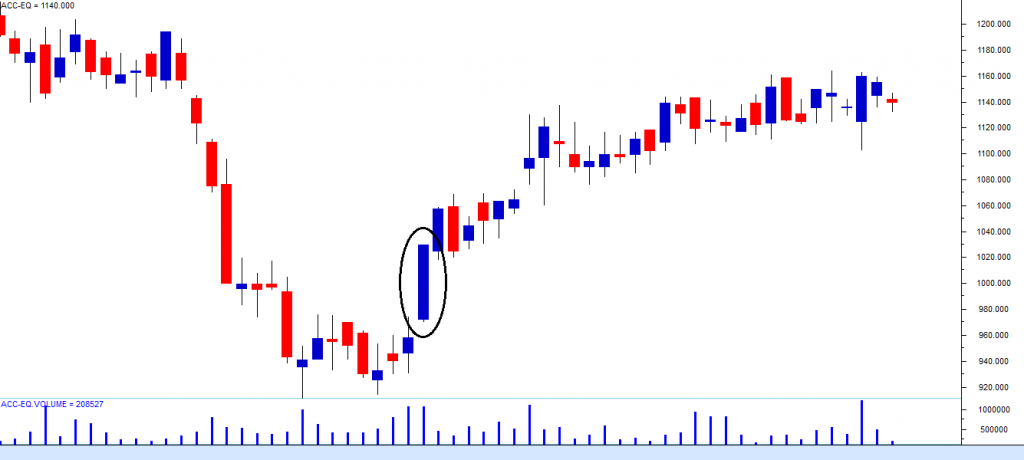
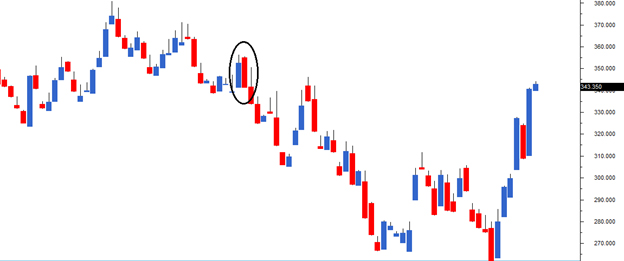
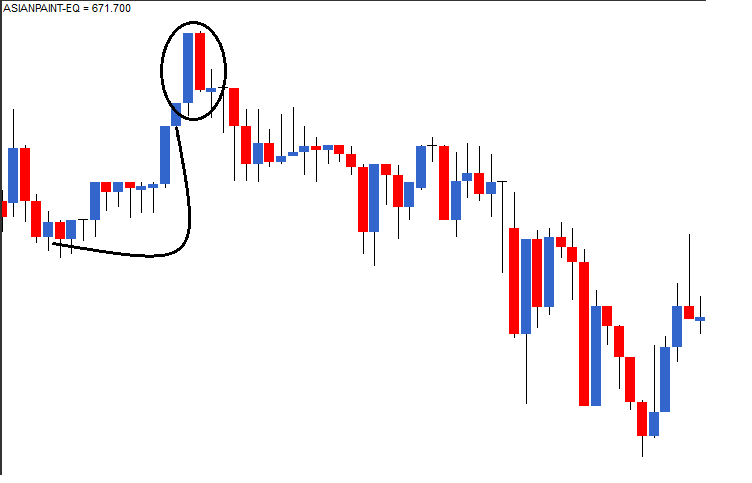
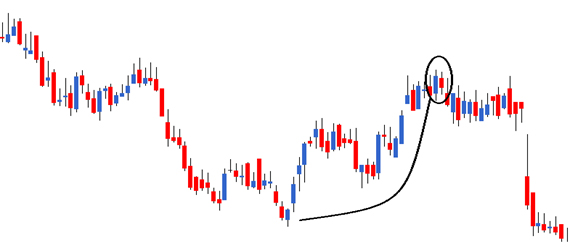
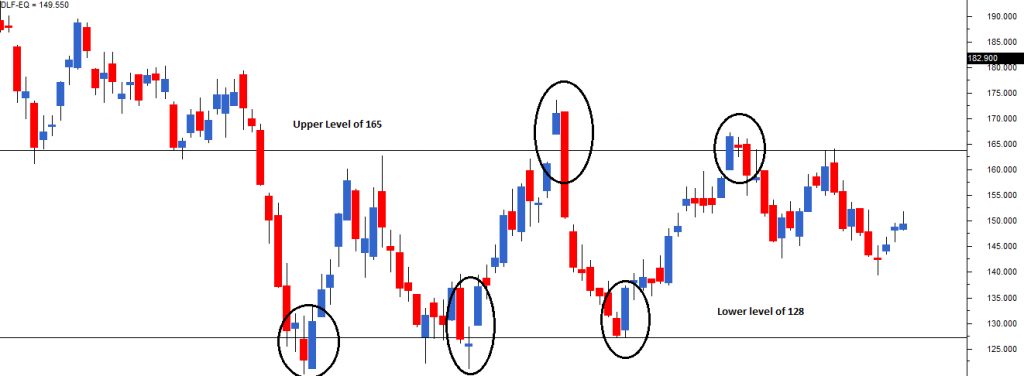
Identify three sticky zones- hesitated to move up or down after a brief up or down move.
Sharp reversal after a particular price point.
Identify at least three price action zones that are at the same level.
Important to find the point in every space in time.
Identify current market price based on which line is s and r.
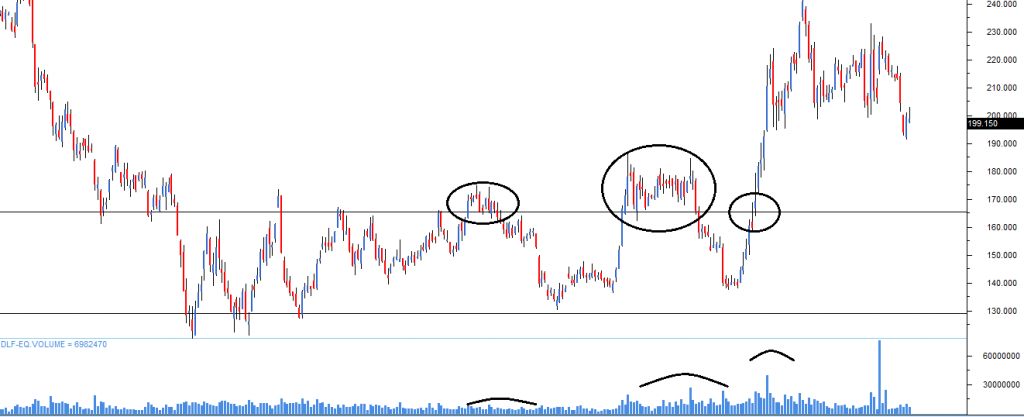
Volume Basis

Volume should be seen with a reference point and it is usually the volume of the average of the last 10 days.
Thumb rule
High vol = todays vol > last 10 day avg
Low vol= todays vol< last 10 day avg
Moving averages(MA)
Avg of the latest 5-day data point.
Simple moving average(SMA)

Line overlay on charts on how averages are behaving.
Exponential moving averages
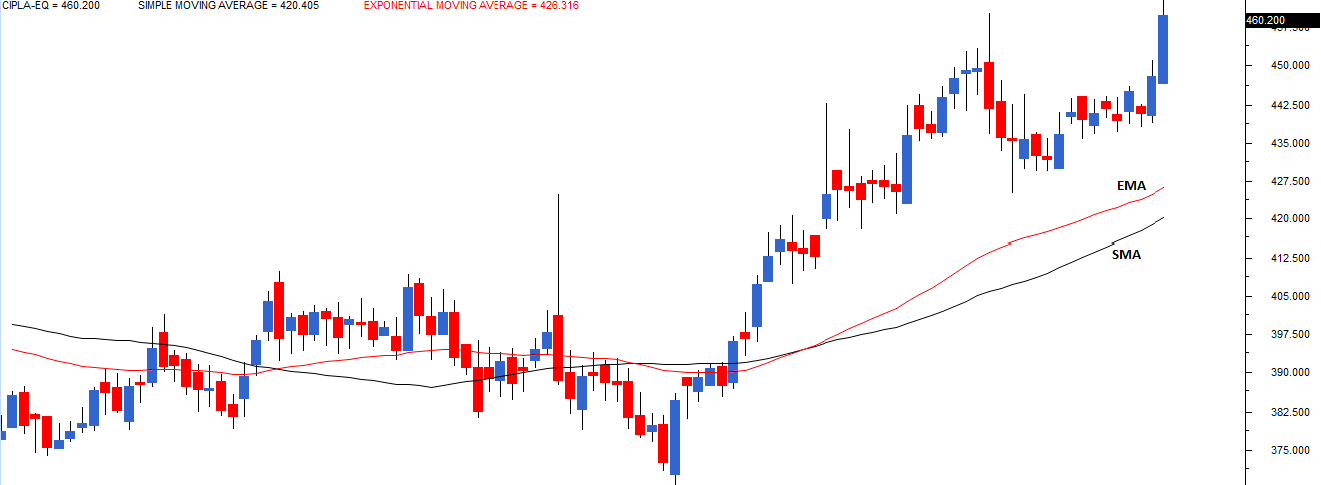
The newest data point is given more weight.
Rules on moving averages system
R1= go long when the current market price is greater than 50-days EMA. invest till necessary sell conditions are satisfied.
R2= exit the long position when the current market price turns less than 50-day EMA.
MA Crossovers
Use of two types of moving averages.
Short term = 50 day MA
Long term = 100 day MA
Rule 1 = Buy when short term MA above the long term MA
Stay in trade as long as the condition is satisfied.
Rule 2 = Exit the long position when short turn MA moved lower than long term
MA.
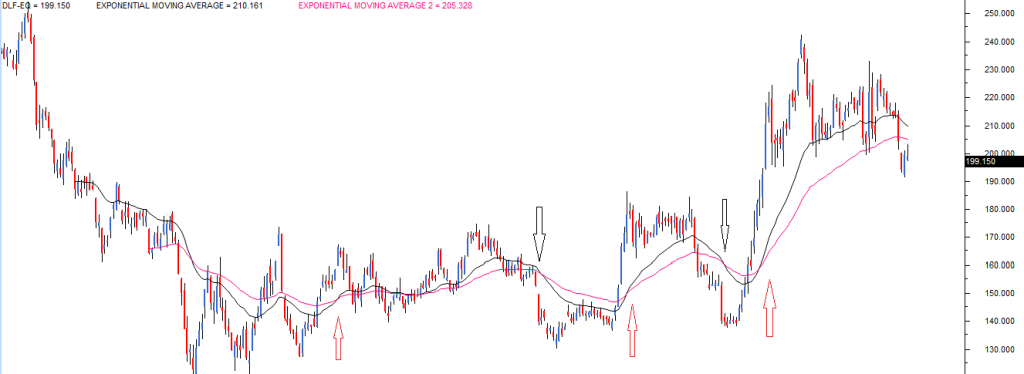
EMA combination
9day with 21 days = short term trade
25 day with 50 days = medium-term trade
100 day with 200 day= long term trade
INDICATORS
Leading- signals a reversal of trend or start of a new trend in advance.
Ex- oscillator
Lagging- signals the occurrence of a reversal or a new trend after it has occurred.
Ex- Moving averages
First indicator
Relative strength index(RSI)
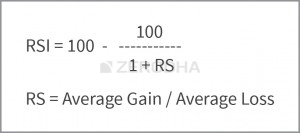
Used for trend reversal and oversold and overbought price areas identification.
RSI Setup
Oscillates between 0 to 100 or 20 to 80 (same).
When reading 0 or 20 security is oversold and ready for an upward correction.
When reading 80 or 100 security is overbought and expected to be a sell-off.
RSI is always used along with another candlestick pattern to study the market.
Second Indicator
Moving average convergence and divergence(MACD)
(Short term avg - long term avg) =
- downward movement = Divergence = bullish momentum
+ upward movement = convergence = bearish momentum
The advanced version (9-day signal line) is the EMA of the MACD.
MACD System - Difference b/w short- long = 12-26
9-day EMA of the MACD
The sentiment is bullish when the MACD line crosses above 9 days EMA where MACD > 9-day line.
The sentiment is bearish When the MACD line crosses below the 9-day MACD line.
Third indicator
Bollinger Band(BB)
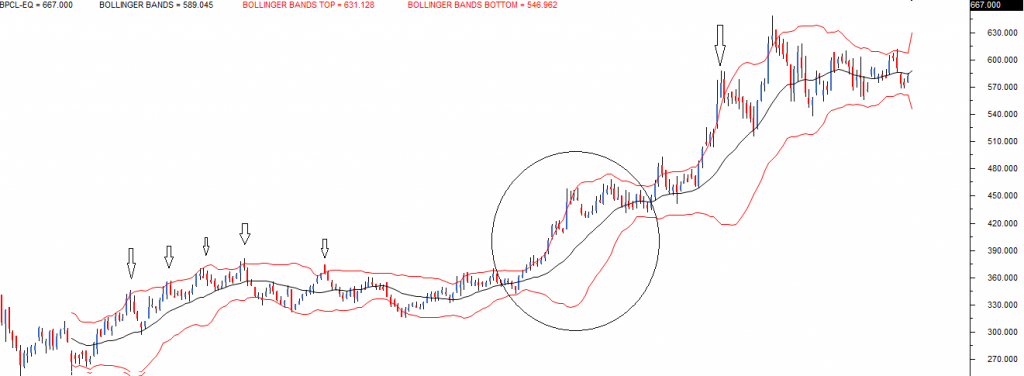
To identify overbought and oversold levels.
It has 3 components- Middle line = 20 day SMA
Upper band=+2 standard deviation of the middle line
Lower band= -2 standard deviation from the middle line
Ex- If SMA = 7800 and SD= 75
UB = 7800+75*2= 7950
LB = 7800-75*2= 7650
The Dow Theory
The double bottom and top formation
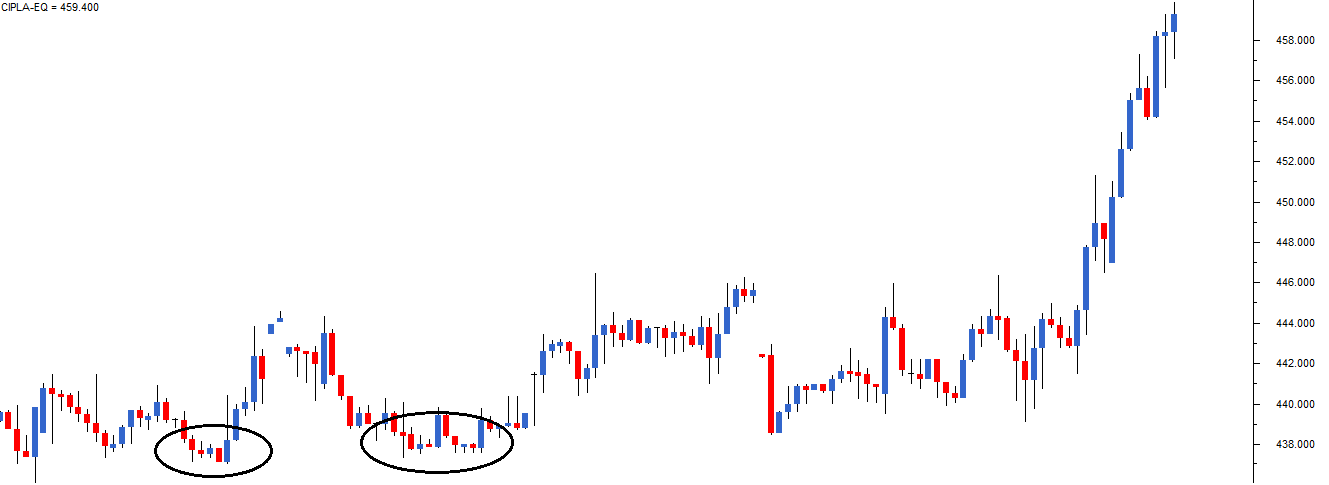
Considered a reversal pattern.
It is considered bullish hence one should look at buying opportunities.
Similar top formation but bearish in nature.
The triple bottom and top formation
Same with three bottom and top formations.
The trading range
Provides multiple opportunities to trade both ways ( long and short).
Range breakout
Traders will initiate a long position when the stock price breaks above resistance and short when breaks down below the support level.
Look for a true breakout
Volumes are high on the breakout or immediately after the breakout.
After breakout momentum is high.
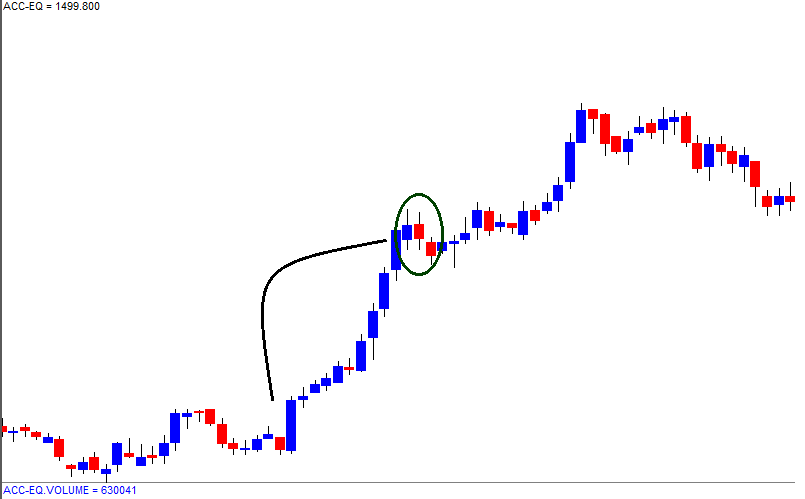
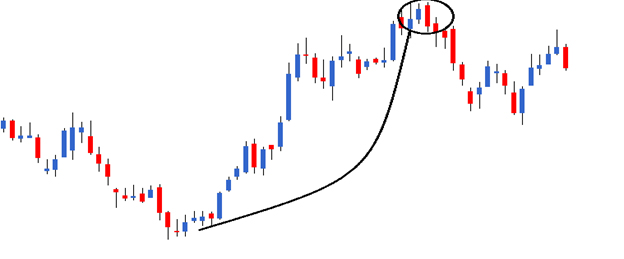
Flag Formation

Big move with short correction.
Risk To Reward Ratio(RRR)
(entry - stop loss/exit - entry)
Look for trades that have rich RRR >1.3 or higher.
While trading patterns, structures, and volumes should be taken into consideration with a check on RRR.
The Checklist
Step - 1
Before initiating the trade check for this list.
The stock should form a recognizable candlestick pattern.
S&R should confirm the trade.
Volume should confirm.
Step - 2
Charting software - Paid - Metastick, Ambibroker.
Free - Yahoo Finance and Google Finance.
Step -3
Timeframe
As the thumb rule higher the timeframe, the more reliable the trading signal is.
For a swing, the trader's back period is 6 or 9 months.
For scalper, he uses a 1 or 5 min timeframe and at least 5- day data.
For while plotting S&R levels you should increase the lookback period to 2 years.
Step - 4
The opportunity universe.
Parameter to look upon to identify best stocks -
Ensure the stock has liquidity by looking at bid-ask spreads, the lesser the spread the more liquid the stock is.
Make sure that the stock is in the EQ section (available for day trade).
Nifty 50 and Sensex are called index stocks.
Step - 5
The shortlisting period
Look at all the charts of stocks in the opportunity universe.
Look at the last 3-4 candles, recognize the pattern is developed.
If you find a shortlist for further investigation.
Evaluation Process
After the stocks are shortlisted now proceed for detailed analysis giving 15-20 min to each chart.
Look for prior trends and if everything seems good look for volumes> 10-day average.
Check For S&R
Long trade(support) and short trade(resistance). If S&R level > more than 4%
Away stop evaluating the charts and proceed to the next.
Look for Dow Patterns
After that calculate RRR. MIn RRR>1.5
At last look for MACD and RSI indicators.
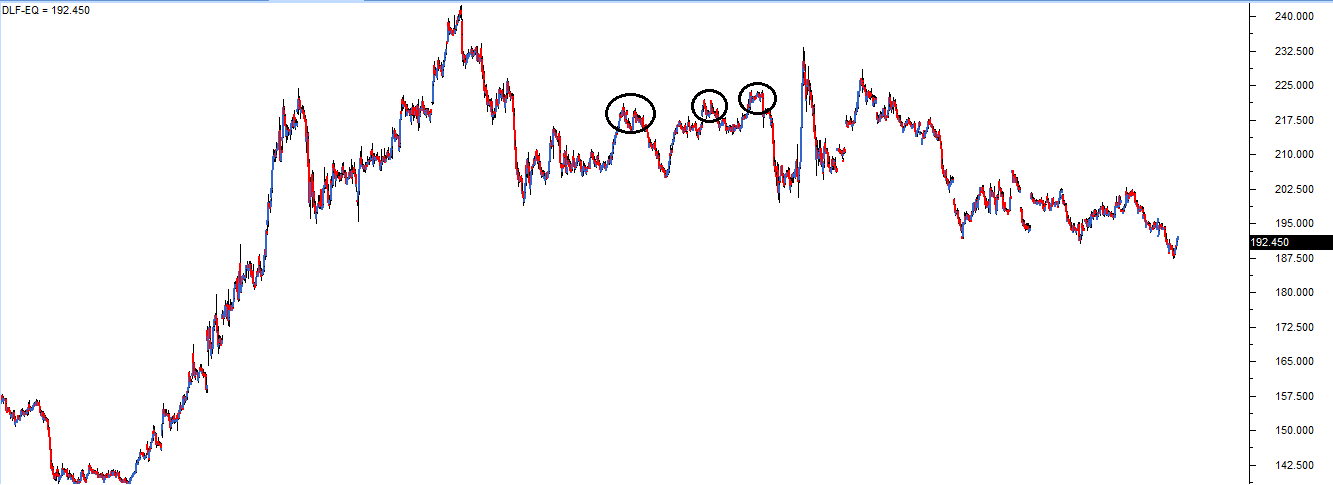
Fibonacci retracements
The Fibonacci ratios, i.e. 61.8%, 38.2%, and 23.6%, help the trader identify the retracement’s possible extent.

I’ve encircled two points on the chart, at Rs.380 where the stock started its rally, and at Rs.489, where the stock prices peaked. I would now define the move of 109 (380 – 489) as the Fibonacci up move. If this stock continues to correct further, the trader can watch out for the 38.2% and 61.8% levels.
Notice in the example shown below, the stock had retraced up to 61.8%, which coincides with 421.9, before it resumed the rally.
We can arrive at 421 by using simple math as well –
Total Fibonacci up move = 109
61.8% of Fibonacci up move = 61.8% * 109 = 67.36
Retracement @ 61.8% = 489- 67.36 = 421.6
Comments
Post a Comment